In this post, you will learn how to make your own math worksheets in 5 easy steps!
We all know that teacher resources are limited, and many of us do not even have access to textbooks. Have you ever looked for a worksheet online, finally find one, then spend time changing it to fit your needs? It was a never ending cycle for me!
That is why I started creating my own resources for my classroom. I now use 100% of my own resources! And the best part? I didn’t pay for any fancy software. I use PowerPoint and Excel–and teachers get these for free with their school email!
This post will show you step-by-step how I create my own math resources.
Get your free printable guide with the steps here!
Before you begin: Set up your page
Before your make your own math worksheets, you will need to know some PowerPoint basics.
If you haven’t read my blog post about making your own teacher resources, start here (don’t worry, the page will open in a new tab so you won’t lose your spot here).
In that post, I go over the basics of PowerPoint, getting your page set up, and more! Once you have read that blog post, you will know how to:
- Add a place for students’ names
- Create a title
- Insert text boxes
- Find and add fun fonts and clipart
- Add your copyright
In this post, we will walk through the specifics of making your own math worksheets including equations, graphs, shapes, and more. Let’s get started!
Step 1. Equations
Equations are an important part of making your own math worksheets. The equation editor on PowerPoint is excellent! Make sure your version of PowerPoint is updated (I currently have the 2019 version).
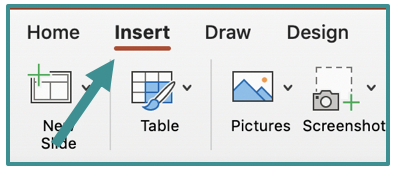
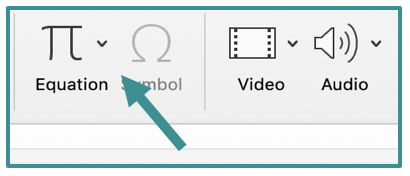
To insert an equation, click “Insert” then “Equation”. A text box will automatically populate. If you do not see the equation button, make your presentation full screen. It will be at the top right of your screen.
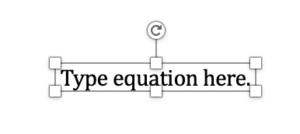
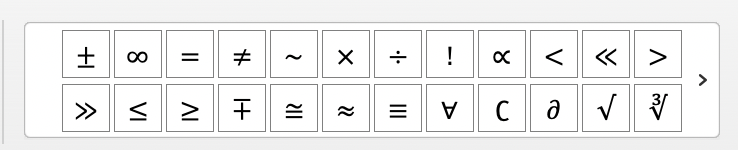
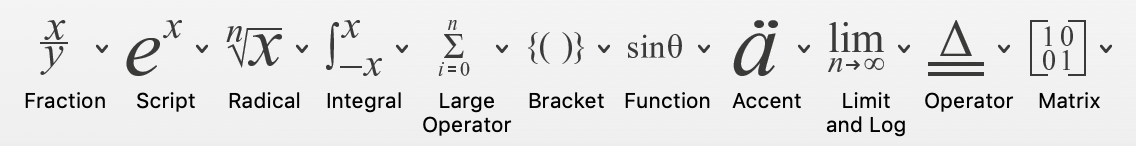
Once you click equation, a new ribbon will appear at the top of your presentation. On the left, you will see various symbols. On the right will be other tools such as the fraction tool and the accent tool.
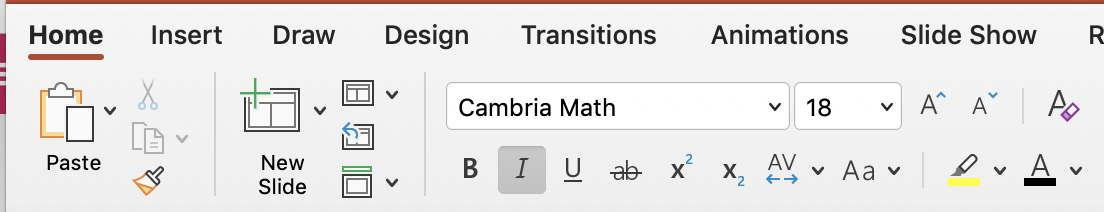
The equation will automatically be written in the “Cambria Math” font. You can change the font by clicking “Normal Font”. Change the font size and style by clicking back to the home tab.
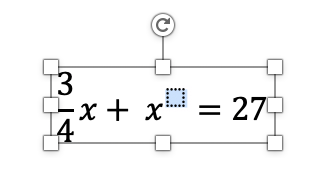
Once you adjust the font, you can click back to the equation tab (far right) and begin typing. For numbers and variables, you can simply type them using your keyboard. For any speciality numbers (square roots, fractions, exponents), click the button you need at the top and then click in the dotted box to type.
The Equation Editor is pretty user-friendly. Just keep experimenting with the different options until you find what you need!
Step 2. Geometric Shapes
If you plan to make your own math worksheets involving geometry concepts, you will need to know about inserting shapes.
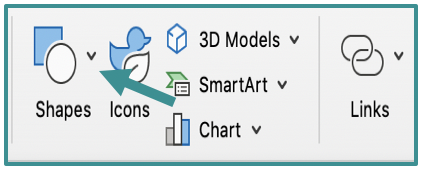
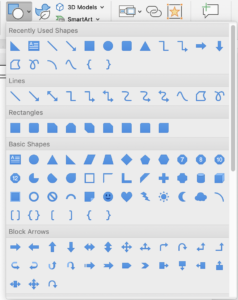
PowerPoint has a good amount of pre-made geometric shapes. To insert a shape, click “Insert” then “Shapes”. A box will open with the different shape options. Next, click a shape you want to insert.
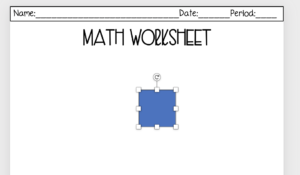
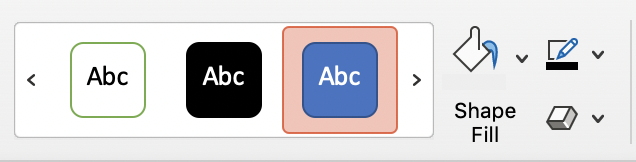
The shape will automatically be blue like the one you see below.
To change the fill (the inside color) or the outline, you can use the ribbon at the top.
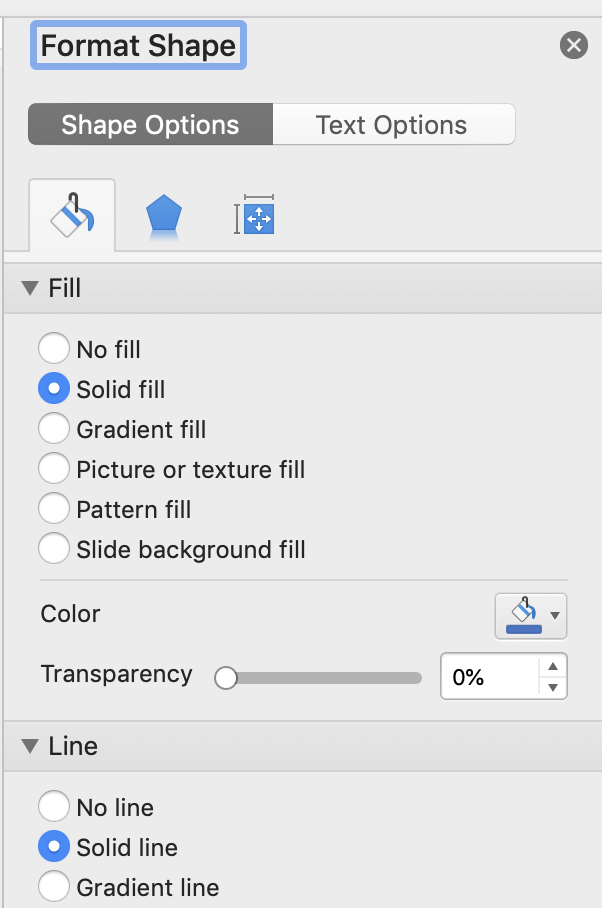
Or, you can double click the shape and a “Format Shape” box will appear on the right. This is the easiest way to edit the shape in my opinion.
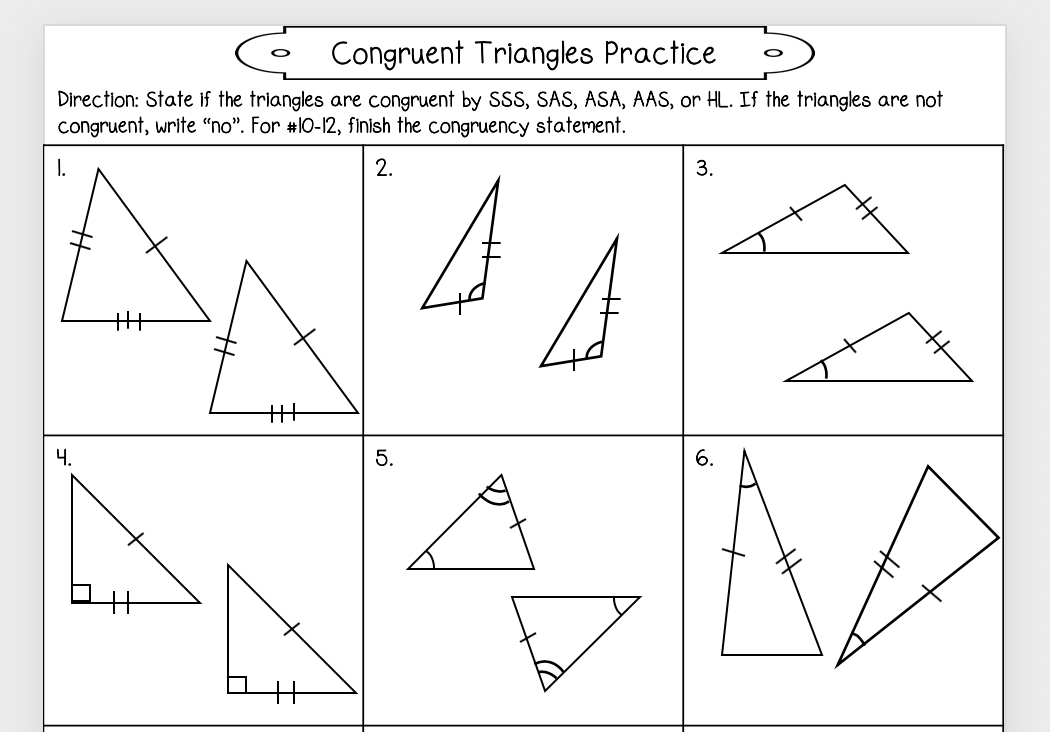
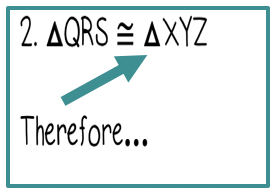
Once your shape is formatted, you can add text boxes, other shapes, and more. For example, when I make congruent triangles, I use the “line” and “arc” shapes to show congruency marks on my triangles.
Step 3. Symbols
The equation editor allows you to insert most mathematical symbols. However, there are some symbols that are not on the editor such parallel markings on a line.
To insert a symbol, you will first need a text box. If you don’t have a text box open, you will not be able to insert a symbol.
Click “Insert” then “Text Box”. Double click inside the text box. For more information about inserting text boxes, make sure to read my post about making teacher resources.
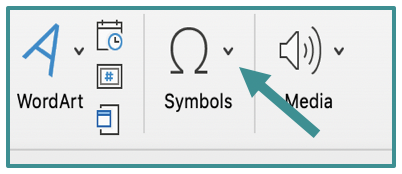
Next, click “Insert” then “Symbols”. A symbol box will open right beside the text box. You can scroll until you find the symbol you need.
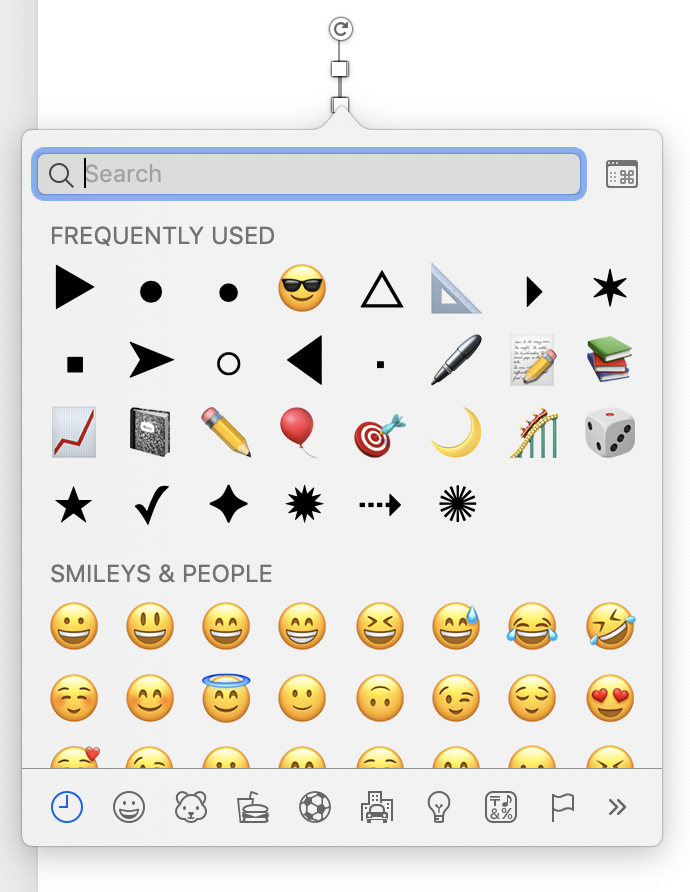
Below are some of the ways I use symbols in my math resources.

Step 4. Tables
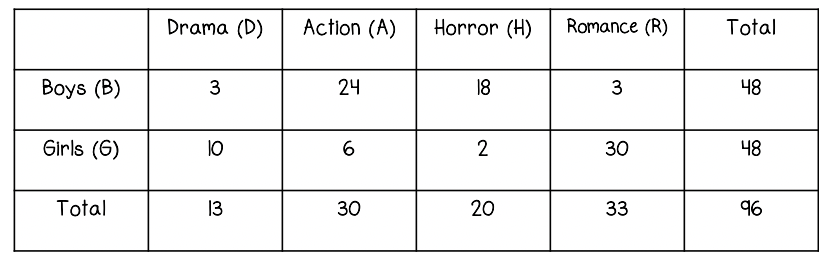
I use tables in almost every resource I make. They are great for organizing your problem sets. You can also use them to make two way frequency tables for a probability resource.
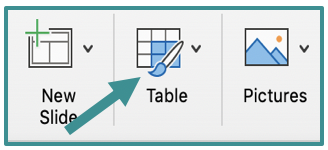
To insert a table, click “Insert” then “Table” which is right below the Insert tab.
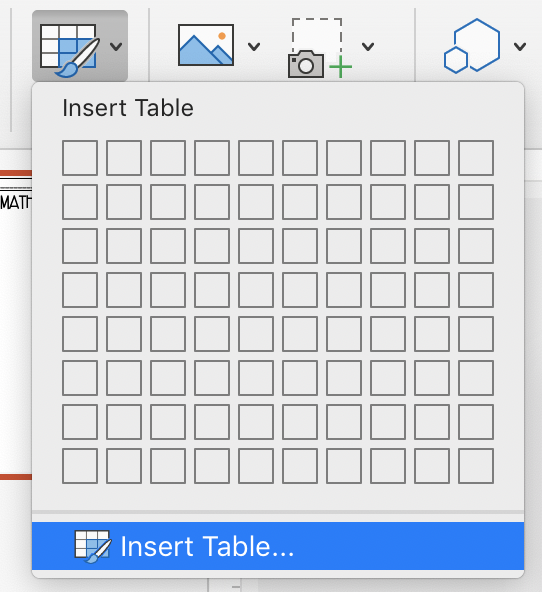
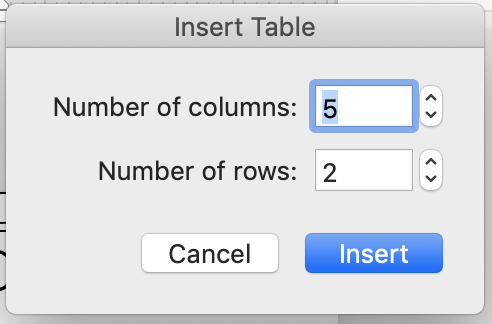
You can draw your own table or click “Insert Table” to enter the dimensions. This way is usually easier. Enter the number of rows and columns you need (you can always add or delete them later), then click “Insert”.
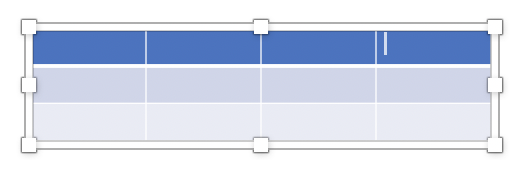
Your table will populate and look like this:
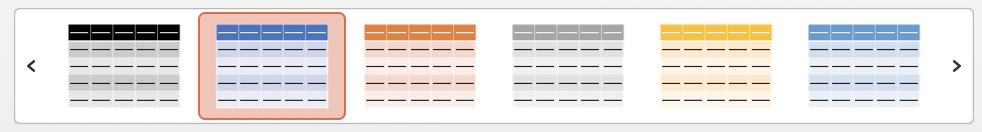
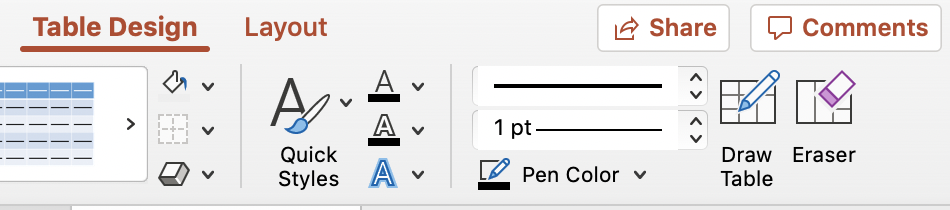
You can edit the style of the table by selecting a preset style from the “Table Design” tab.
Or, you can format the table yourself with the fill and line tools.
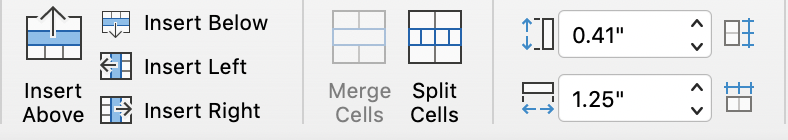
To add or subtract rows or columns, merge cells, or change height/width, click the “Layout” tab.
Here are some of the ways I use tables in my math resources.

Step 5. Graphs
Graphs were the most difficult skill for me to learn. However, once I learned how to insert graphs, my life became SO much easier! To insert graphs, you need both PowerPoint and Excel.
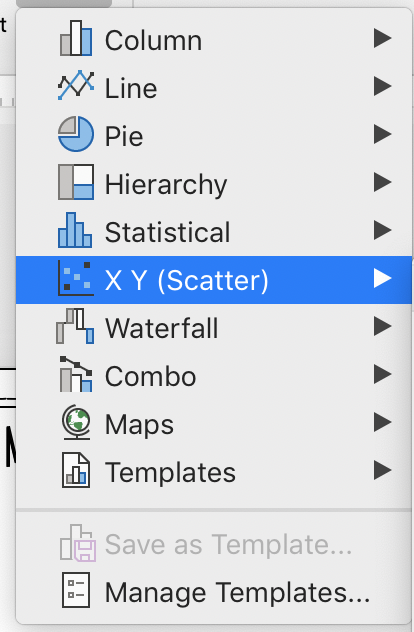
To insert a graph, click “Insert” then “Chart”.


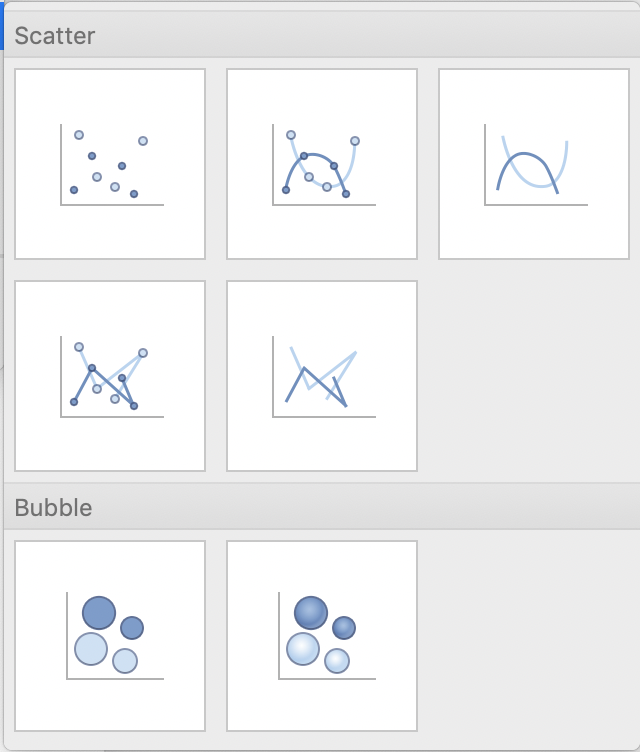
Choose X Y (Scatter) and click the first one or second one (depending on if you want connected points or not).
An Excel workbook will automatically open and a chart will open on your PowerPoint presentation.

Format Axes
Don’t worry about the Excel workbook right now. Minimize Excel and format your chart first. Delete the title by right clicking and select “delete”.
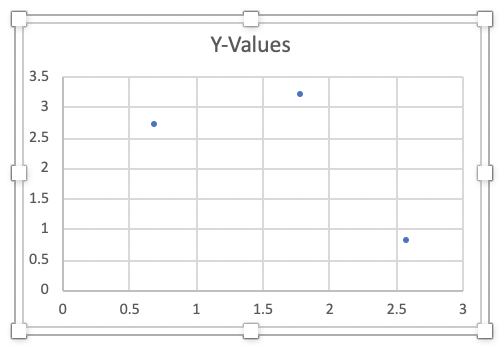
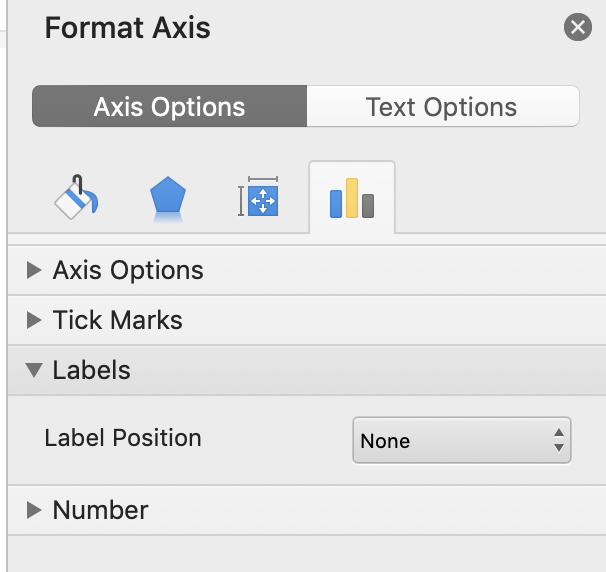
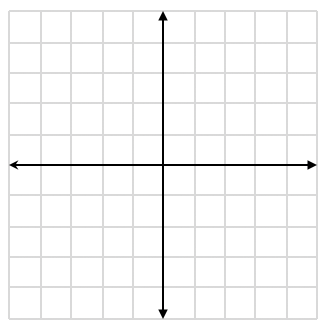
To change the x and y values, double click on the actual axis (the line). A “Format Axis” box will open on the right. You can change the maximum, minimum, and axis labels. These are the settings I use:

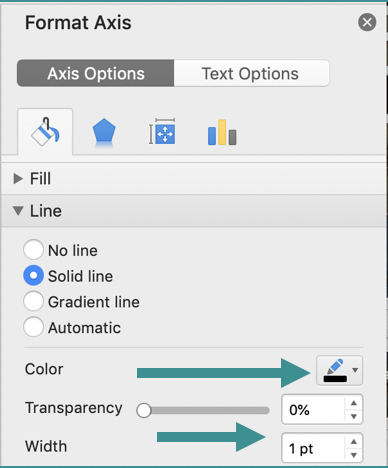
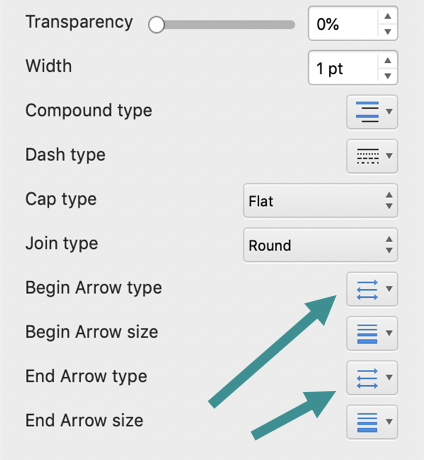
To change the axis line color, thickness, or ending shape, click on the paint bucket at the top left of the “Format Axis” box.
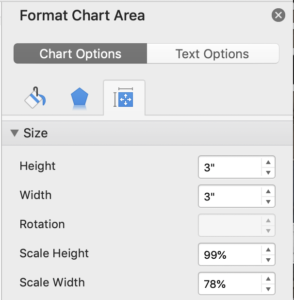
To change the size of your chart, double click the outside border of your chart. Then adjust the width and height in the “Format Chart Area” box.
Your chart should now be looking more like a graph!
Add Points
To add data points, maximize the Excel workbook and delete any preset data. You can add (x, y) coordinates by simply typing numbers in each column. They will automatically populate on your graph.
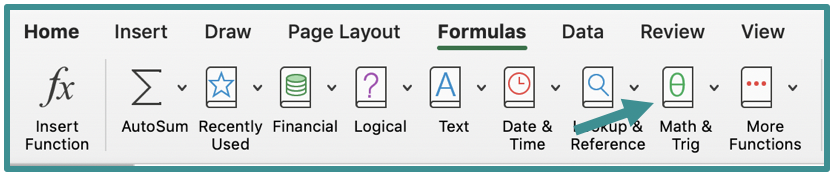
Excel also has formulas built into the software such as quadratic and trigonometric functions. To use these, click the “formulas” button. Then click Math & Trig. Scroll down to find the formula you need.
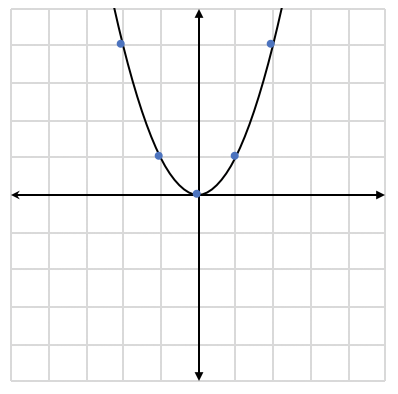
Once you enter your data and choose your formula, the points will automatically populate on your chart.
Here is an example of a completed quadratic graph:
Since writing this blog, I have had so many questions about my graphs. I decided to make a whole blog post just about graphs! Check it out here.
I hope this information has been helpful in getting you started on the journey to create your own math resources! If you want to learn more about creating your own engaging resources head to LindsayBowden.com/Training to sign up for my FREE training!
Get the free printable version of these steps plus more details here!
Happy Teaching! If you use any of these tools, please let me know below!