
Inequality graphs are very important for Algebra 1 math resources! Teachers need these graphs to make sure students understand the concept of linear inequalities and systems of inequalities.
Have you ever tried to create a math worksheet, but you just couldn’t create graphs like you wanted? You may have used screenshots from graphs you found online. They are blurry and not formatted how you want. That’s probably how you found this post!
I used to really struggle with making worksheets and other math resources. That’s why I was determined to learn how to create my own graphs and other math graphics!
In this post, I’ll show you exactly how to create a linear inequality graph (and systems of linear inequalities).
If you want more information about creating math resources, then click to grab my free 5-step cheat sheet for creating math resources.
Step 1: Create or Insert a Coordinate Plane
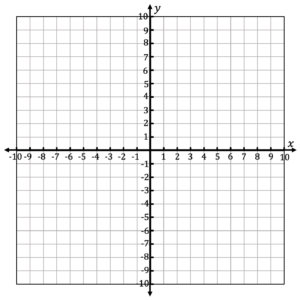
I create all of my graphs using PowerPoint. First, open a new PowerPoint presentation and change the size of the slide to be a square (I use 2 inches by 2 inches).
Next, you want to create a coordinate plane or insert a piece of coordinate plane clipart. I have coordinate plane clipart here. You can also learn how to create your own by coordinate planes in PowerPoint by clicking here.
Step 2: Draw a Line
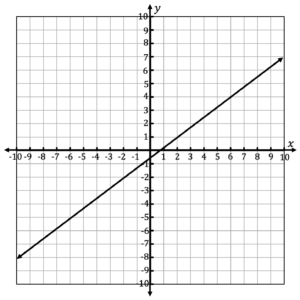
Then, you want to use the shape tool in PowerPoint to create a line. Change the thickness and color of the line using the Format Shape menu.
I use black lines with a thickness of 2. You can also create dashed lines for < or > inequalities. Just change the “Dash Type” to the one you want.
If you are creating a system of inequalities, then add two lines. You can make both lines solid, both dashed, or one solid and one dashed.
Step 3: Use the Freeform Shape Tool to Shade
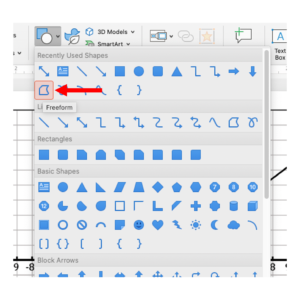
Next, we want to create the shading. Click insert > shape > Freeform. Starting at the bottom left corner of the graph, click once. Then follow the vertical border of the graph up to the line. When you get to the line, click again.
Follow the diagonal of the line and click when you get to the right vertical border of the graph. Click again. Then follow the vertical border of the graph down to the bottom right corner and click.
Finally, follow the bottom horizontal border of the graph until you get back where you started. Click, and a blue shape will appear.
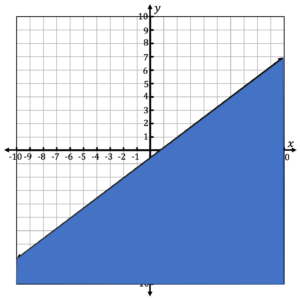
Format the shape by changing it to grey (or any other color you want). Change the transparency to 50%-75%. Get rid of the line around the shape.
Step 4: Save the Inequality Graph as a Picture
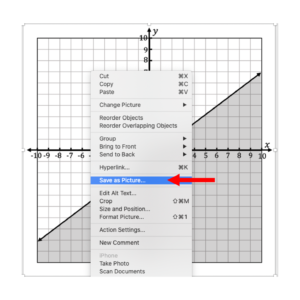
Once you are done with the shading portion, you want to save your graph as a picture. Then, you can insert it into any math resource you are creating.
Right click on the graph and select “Save as Picture”. You can save it as a JPEG or PNG. I always save mine to my Desktop so I can easily find it.
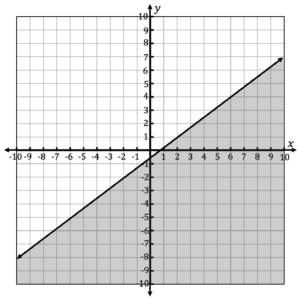
And that’s it! Now you have a linear inequality graph that you can insert into math worksheets and resources for your students!
Creating engaging resources doesn’t have to stop here! Head to LindsayBowden.com/Training to sign up for my FREE training on creating engaging math resources!

Comment if you are creating your own math worksheets! Tag me on Instagram @LindsayBowden. I’d love to see what you’re making.
You may also like: