Do you create your own resources? Have you struggled finding or creating exactly what you need when it comes to graphs? It can be so time consuming and frustrating, especially when it comes to more complicated graphs. Well, I have found an amazing website to help you make graphs for free!
In this post I am going to show you step by step how to use GraphFree.com to make customized graphs for your resources!
I personally use PowerPoint and create graphs with Excel to create all of the graphs for my resources, but this website is now another great option for you to use to make graphs for free.
Website Layout
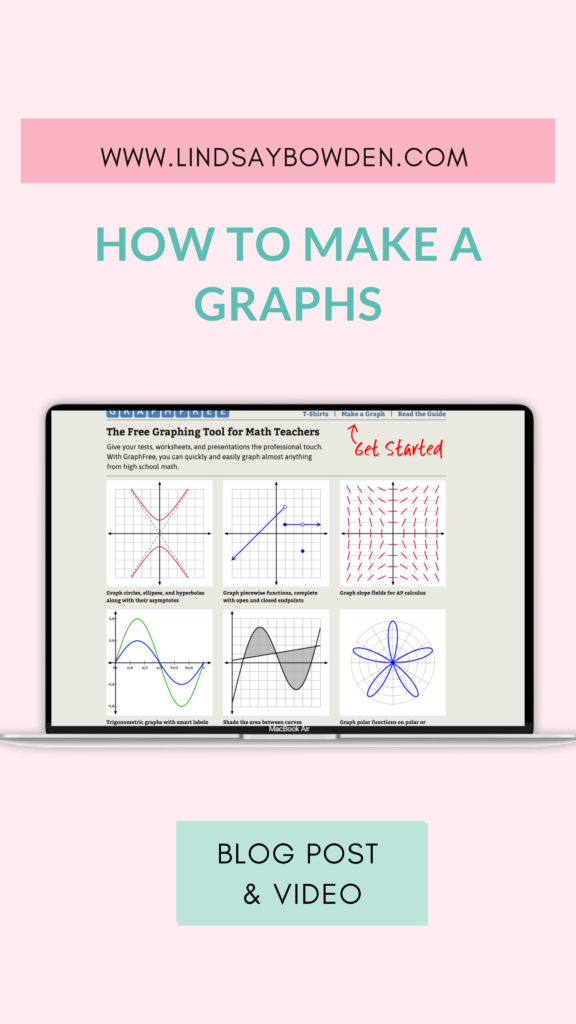
In your browser go to graphfree.com. Then, click “Start Graphing Now” on the homepage.
The first dropdown menu includes helpful tips to make more complicated graphs. This is a good place to read through the features and find instructions on how to use the site to create your graphs.
The “Plot Size” drop down menu allows for you to make bigger or smaller graphs based on pixel size.
Create a Graph
To start graphing, you will click the “Plot #1” drop down menu.
You will notice that underneath “Plot 1” it has a selection menu where you can choose what type of graph you are creating. There are options for asymptotes, piecewise, XY scatter plots and more!
For this tutorial we will be selecting “Function” to make a basic function graph. Next, type your equation next to “f(x)=”. For example, type “x+2”.
Next, select the properties you want your graph to have. There are options for arrows at the graphs edges, the color of the line, and line style.
Your graph will show up in the graph that is located at the top left of the page.
In order to get your graph from this site to your resource we will save the graph as an image. To do this, right click the graph, click “Save image as…” and save the image to your desktop.
Now you can quickly insert that image into whatever resource you are creating!
Graph Systems
After you have created a basic function graph under “Plot 1”, you will notice that there is also drop down menus for “Plot #2” through “Plot #6”. This means that you can graph up to 6 different functions on one graph.
To do this, click “Plot #2” and repeat the process we did to create a basic function graph (refer to “Create a Graph” above for steps).
Then, you can continue adding more lines by selecting the dropdown menu for the plots below.
Graphing Parabolas
If you want to graph a parabola, you will use the “^” key to signify an exponent. For example, to graph f(x)=x2 you would type “x^2” for the equation.
You will see guidelines next to where you type the equation as well as in the helpful hints section of the website to guide you in how to properly type equations in the correct format.
Graphing Inequalities
To graph an inequality you will create a basic function graph, as explained above in the “Create a Graph” section.
Next, you will go towards the bottom of the page and select “Shading”.
In order to tell the graph where you shade you will simply enter in a coordinate point for a point that is included in region where you want the shading to be.
First, type a point or points (if more than one region needs shading) into the “Region(s) to Shade”.
Once you do this, you will see the shading show up on your graph in the top left of the site. You have the option to edit and change the shading color.
The last step is to just save your graph as an image and then insert it into your resource!
Glitches
I have found that there are some glitches in the program. They are nothing too bad, but for instance if I type in “0.5x + 2” for a basic function graph, there is an extra arrow that shows up after the line.
As I stated before, there are a few glitches I have come across, but there are not anything major.
Using Graphs on TPT Resources
I have had multiple students from my Resource Academy reach out to the creator of GraphFree and ask if they were allowed to use the graphs created from his site for commercial use. They have stated that he said they were allowed to.
I have not reached out to him personally to ask so I urge you to reach out to him to ask about using the graphs in your commercial resources. His contact info is listed right at the bottom of the website.
I hope this tutorial was helpful! You can make a lot of different types of graphs very quickly on this awesome website. Plus, who doesn’t love being able to make graphs for free! Do you love using GraphFree to make graphs too?! Comment below or tag me on Instagram and let me know!
You may also like:
How to Make A Number Line Using PowerPoint
Text Effects in PowerPoint for Resource Creation
How to Make Inequality Graphs for Worksheets