Statistics & Data Analysis Workbook for Algebra 1
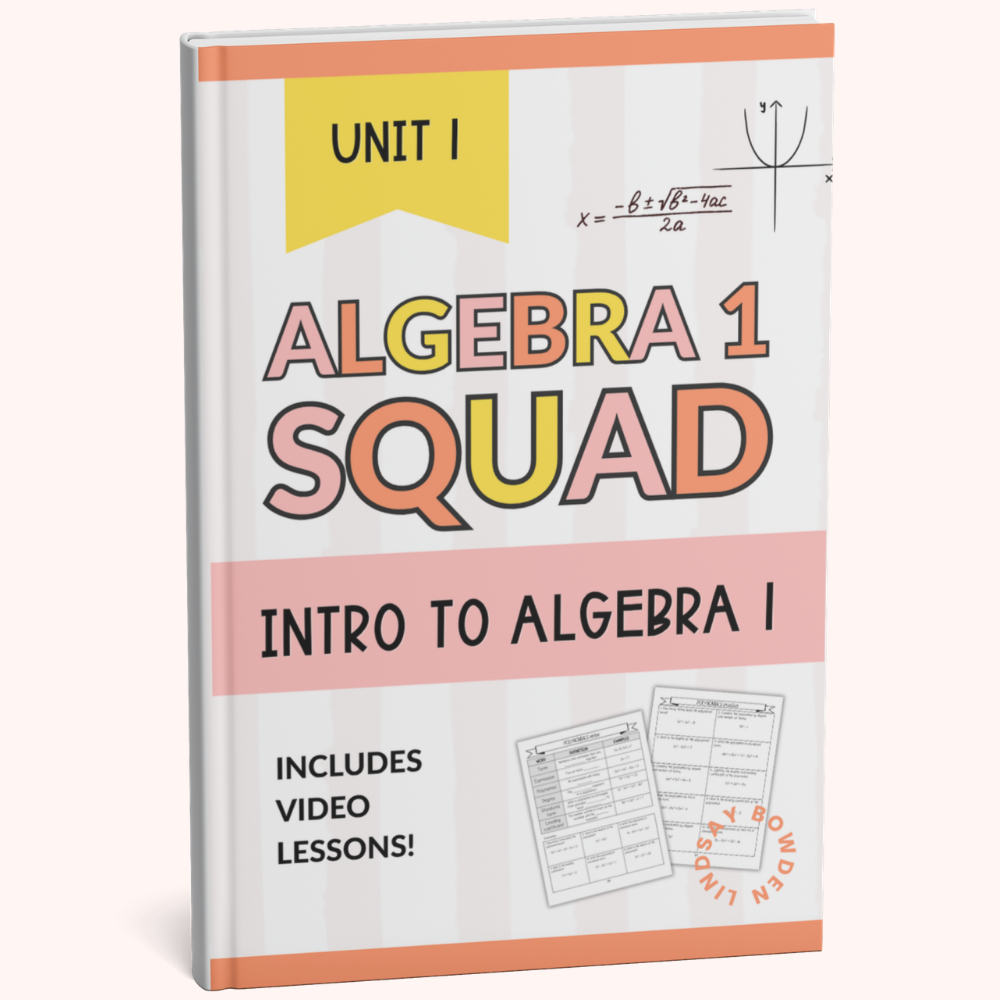
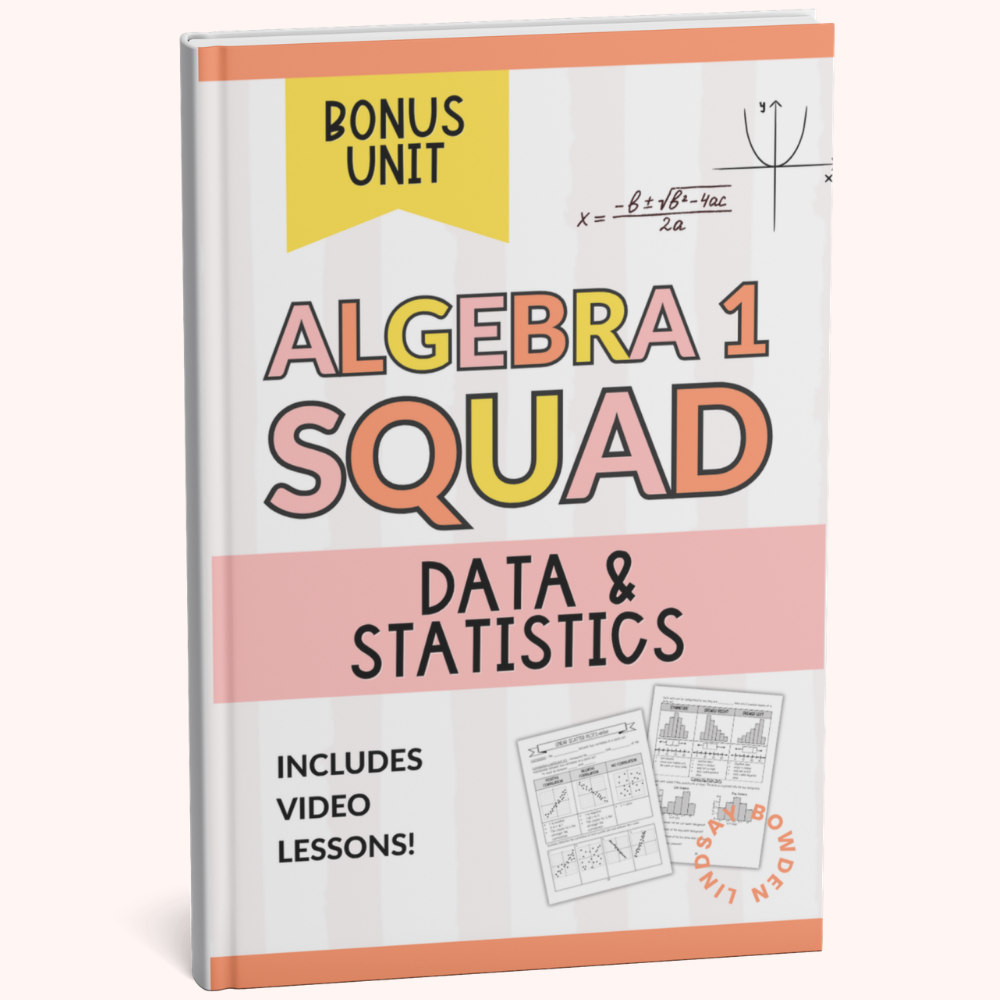
This Statistics & Data Analysis Workbook helps students understand how to organize, represent, and interpret data. Through clear explanations and structured practice, students learn how to analyze data distributions, calculate measures of center and spread, and interpret statistical graphs.
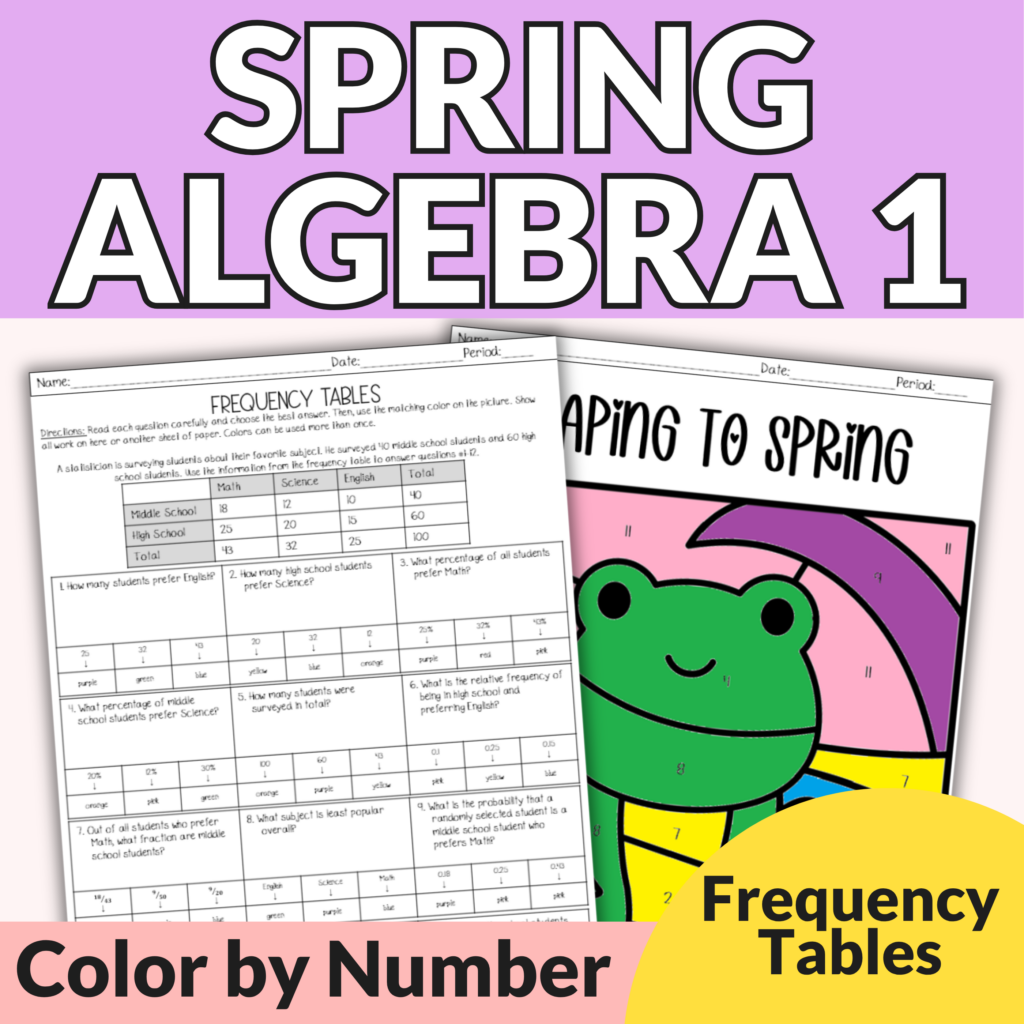
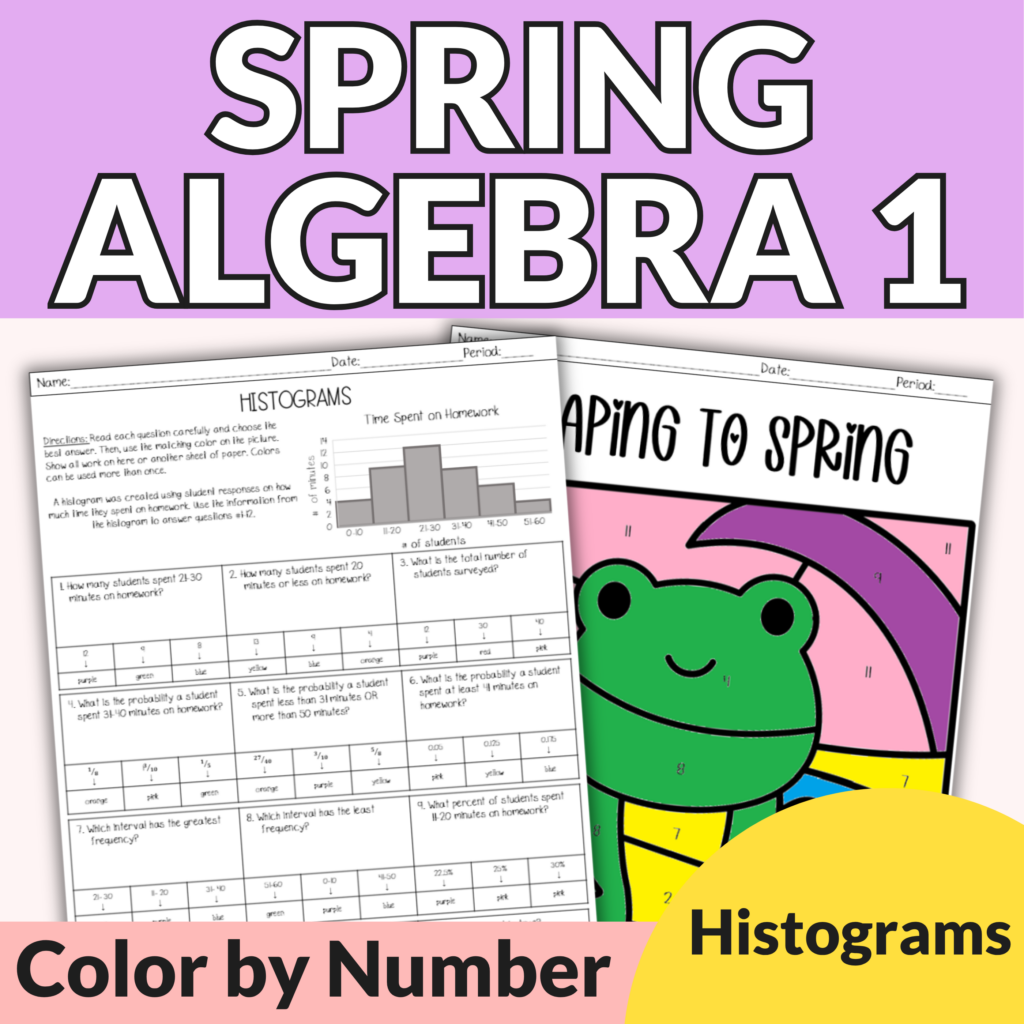
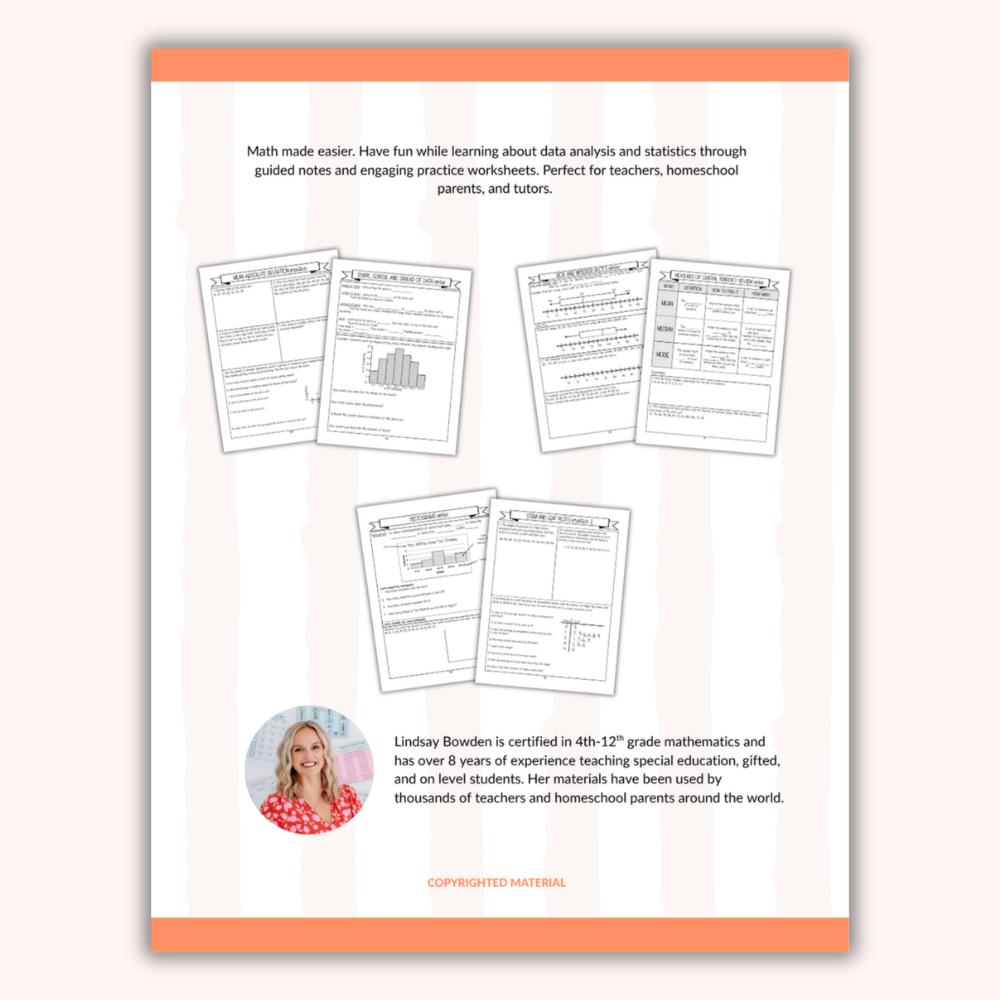
Students begin by exploring measures of center including mean, median, and mode, along with measures of spread such as mean absolute deviation (MAD). They then learn how to organize and represent data using dot plots, stem-and-leaf plots, histograms, and frequency tables.
The workbook also guides students through interpreting data distributions, including center, spread, and shape. Students practice analyzing box-and-whisker plots and comparing data sets.
Students then explore scatter plots and learn how to identify relationships between variables. They practice determining positive and negative associations and interpreting a line of best fit to model trends in data.
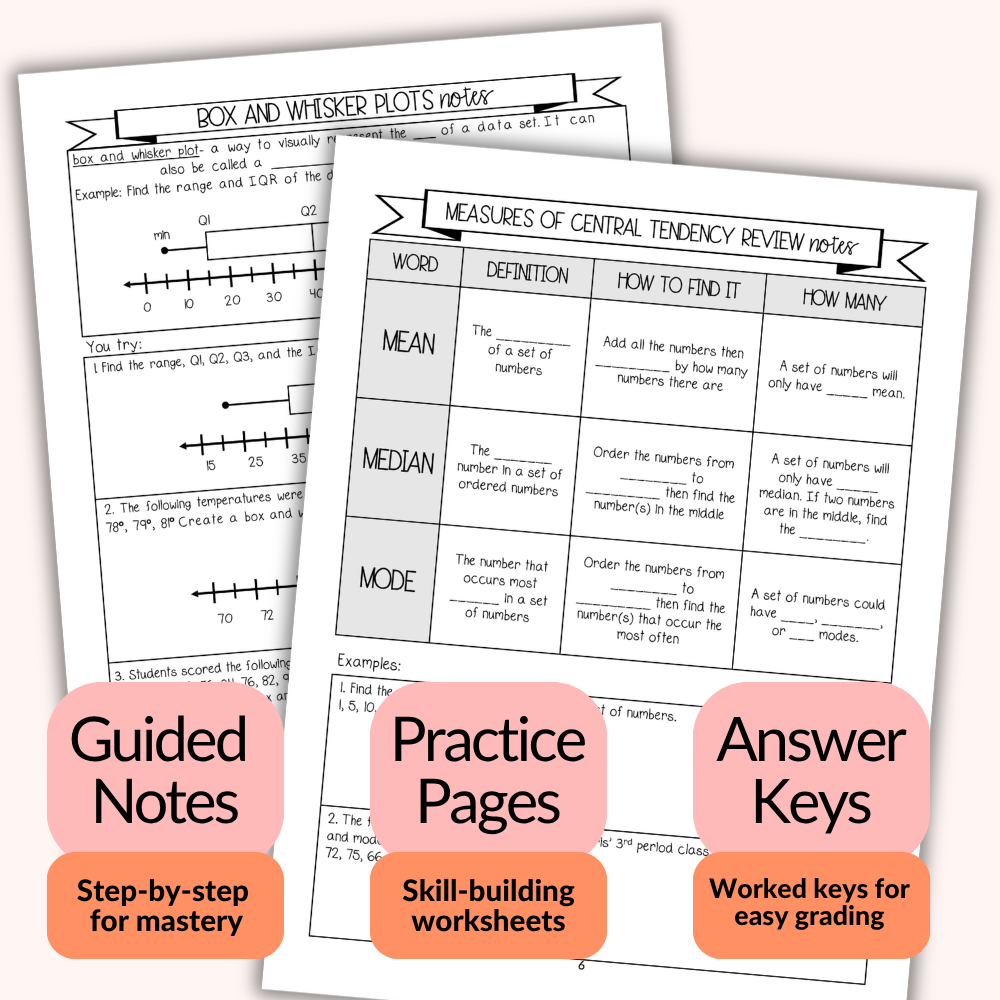
This workbook includes:
- Guided notes with step-by-step explanations
- Practice worksheets for each concept
- Data analysis and interpretation problems
- Scatter plots and line of best fit practice
- Answer keys
- Video lessons for additional support
This workbook is ideal for Algebra 1 students, Pre-Algebra students, homeschool families, and students who need additional practice understanding statistics and data analysis.
Learning to interpret and analyze data is an essential mathematical skill used in science, business, and everyday decision-making. This workbook helps students build confidence working with data through clear instruction and consistent practice.
You may also like...