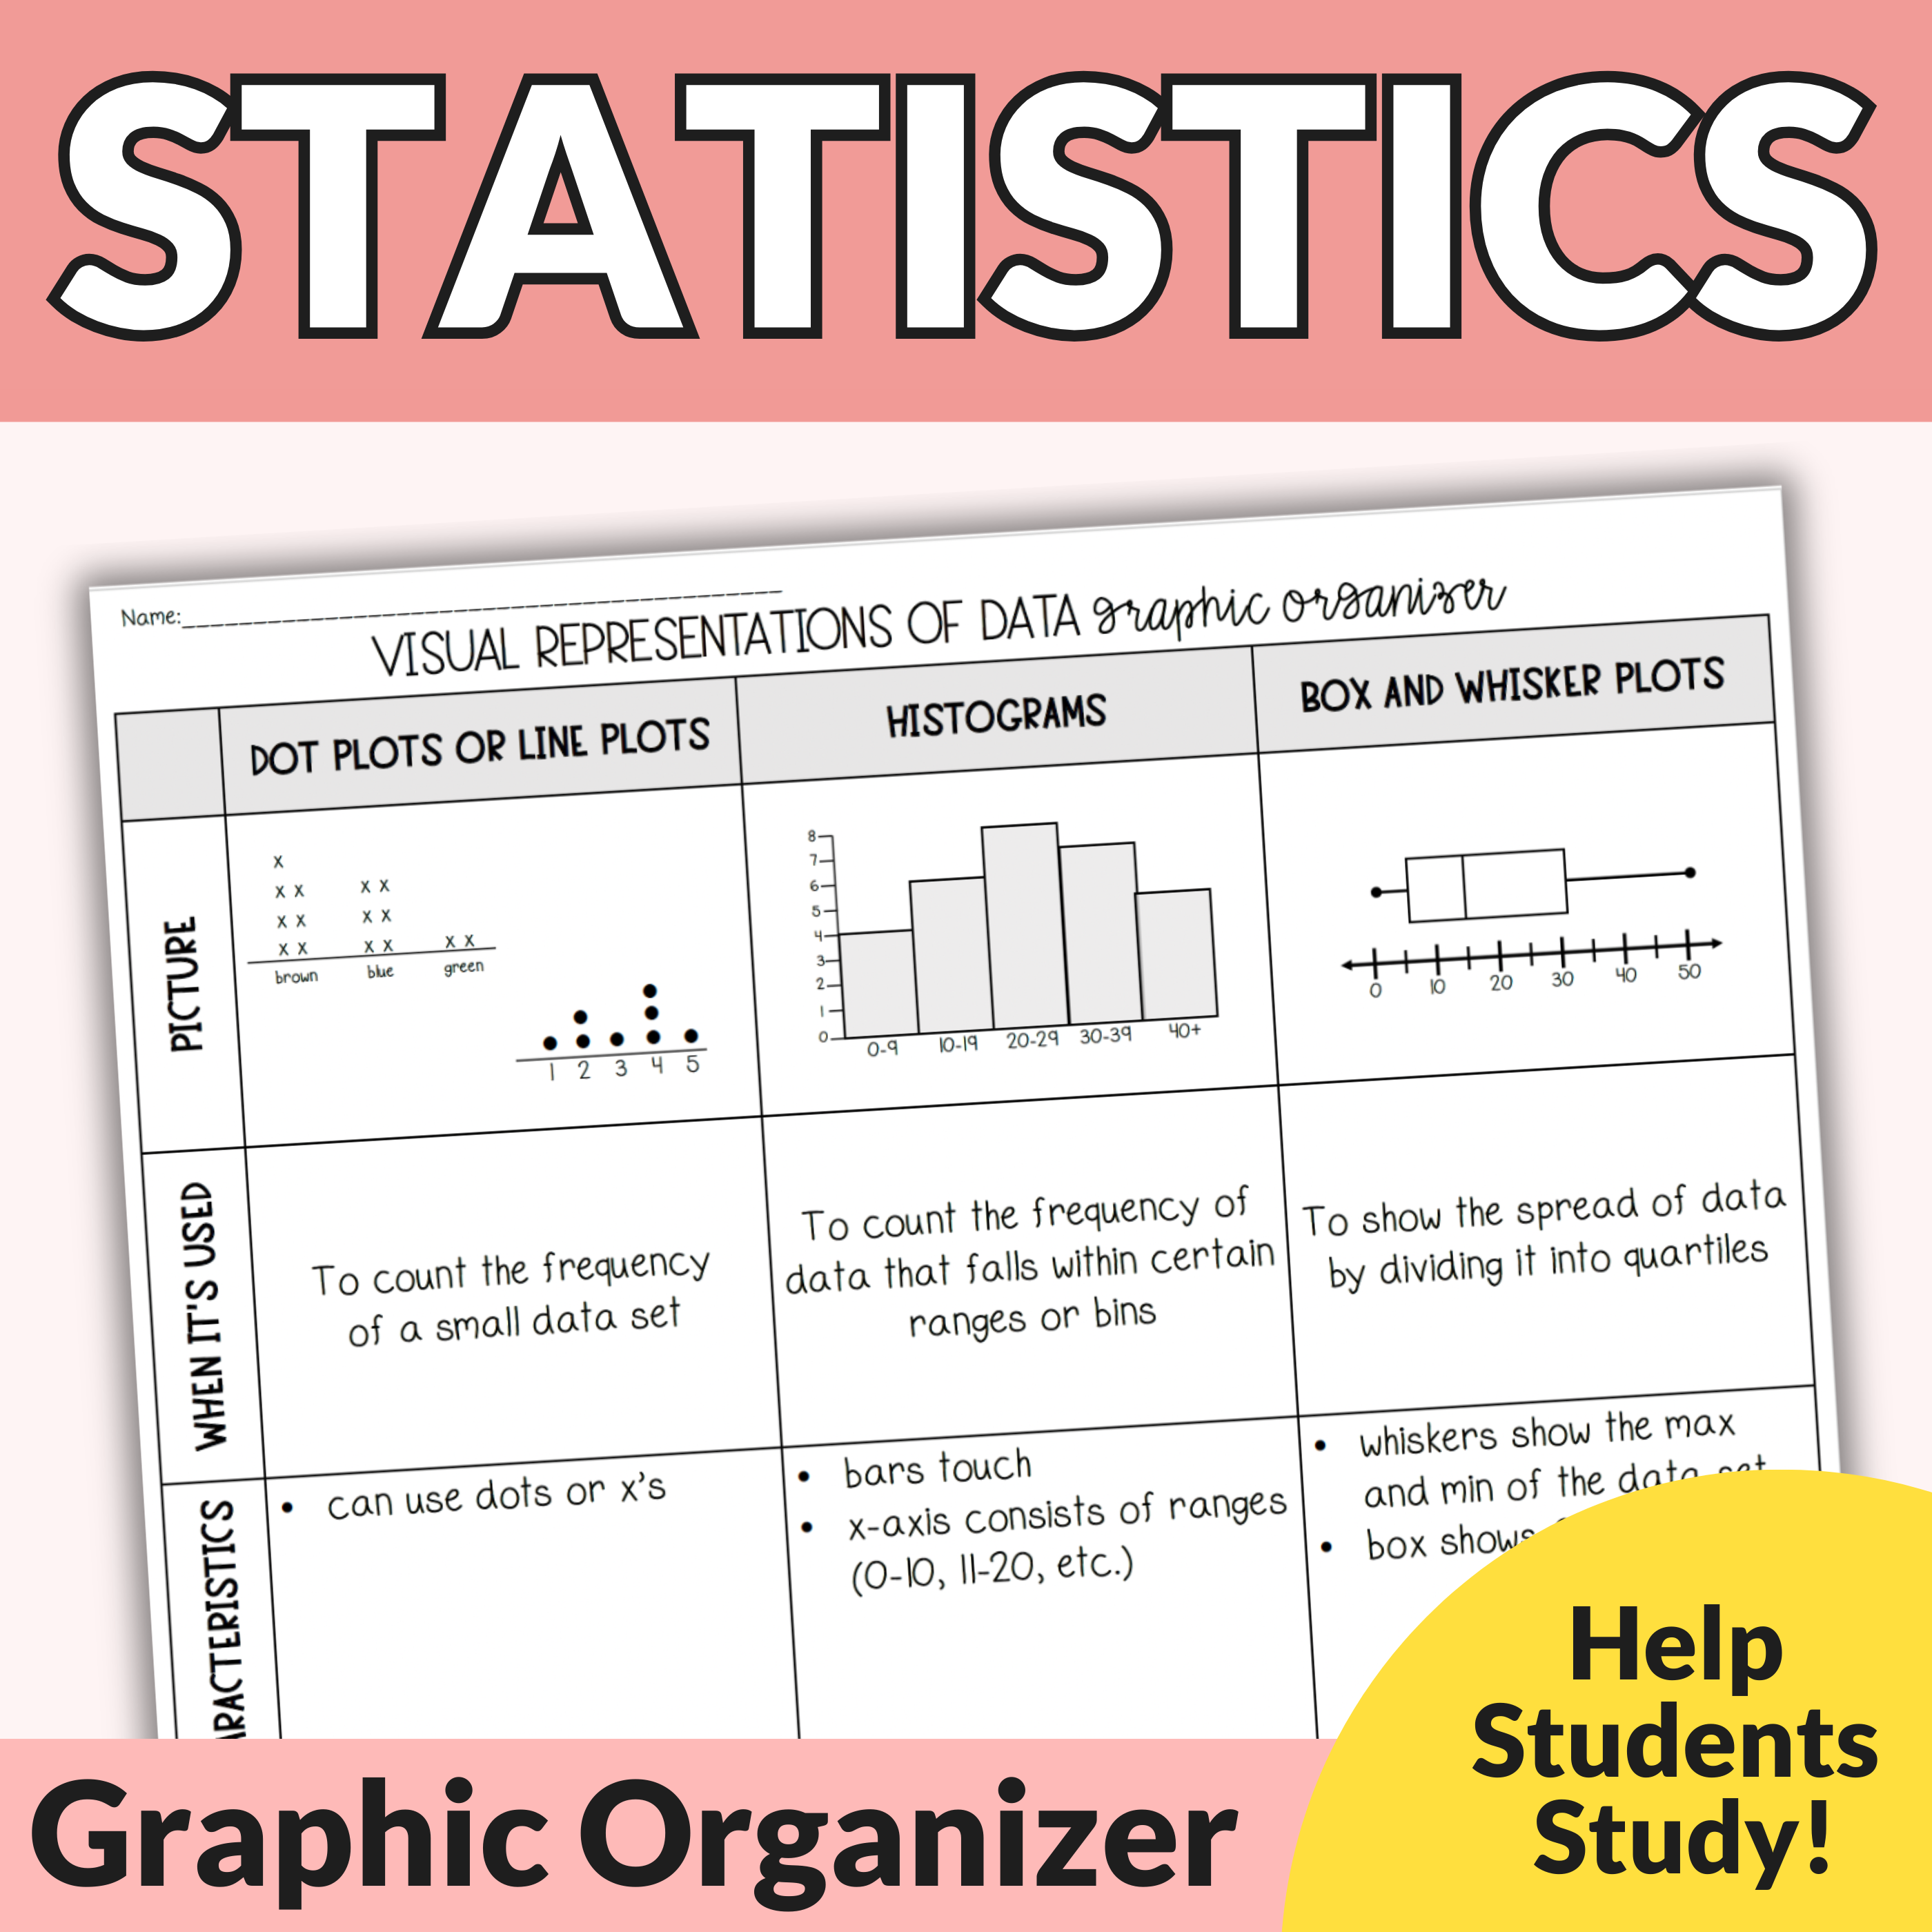
Statistics Graphs Graphic Organizer
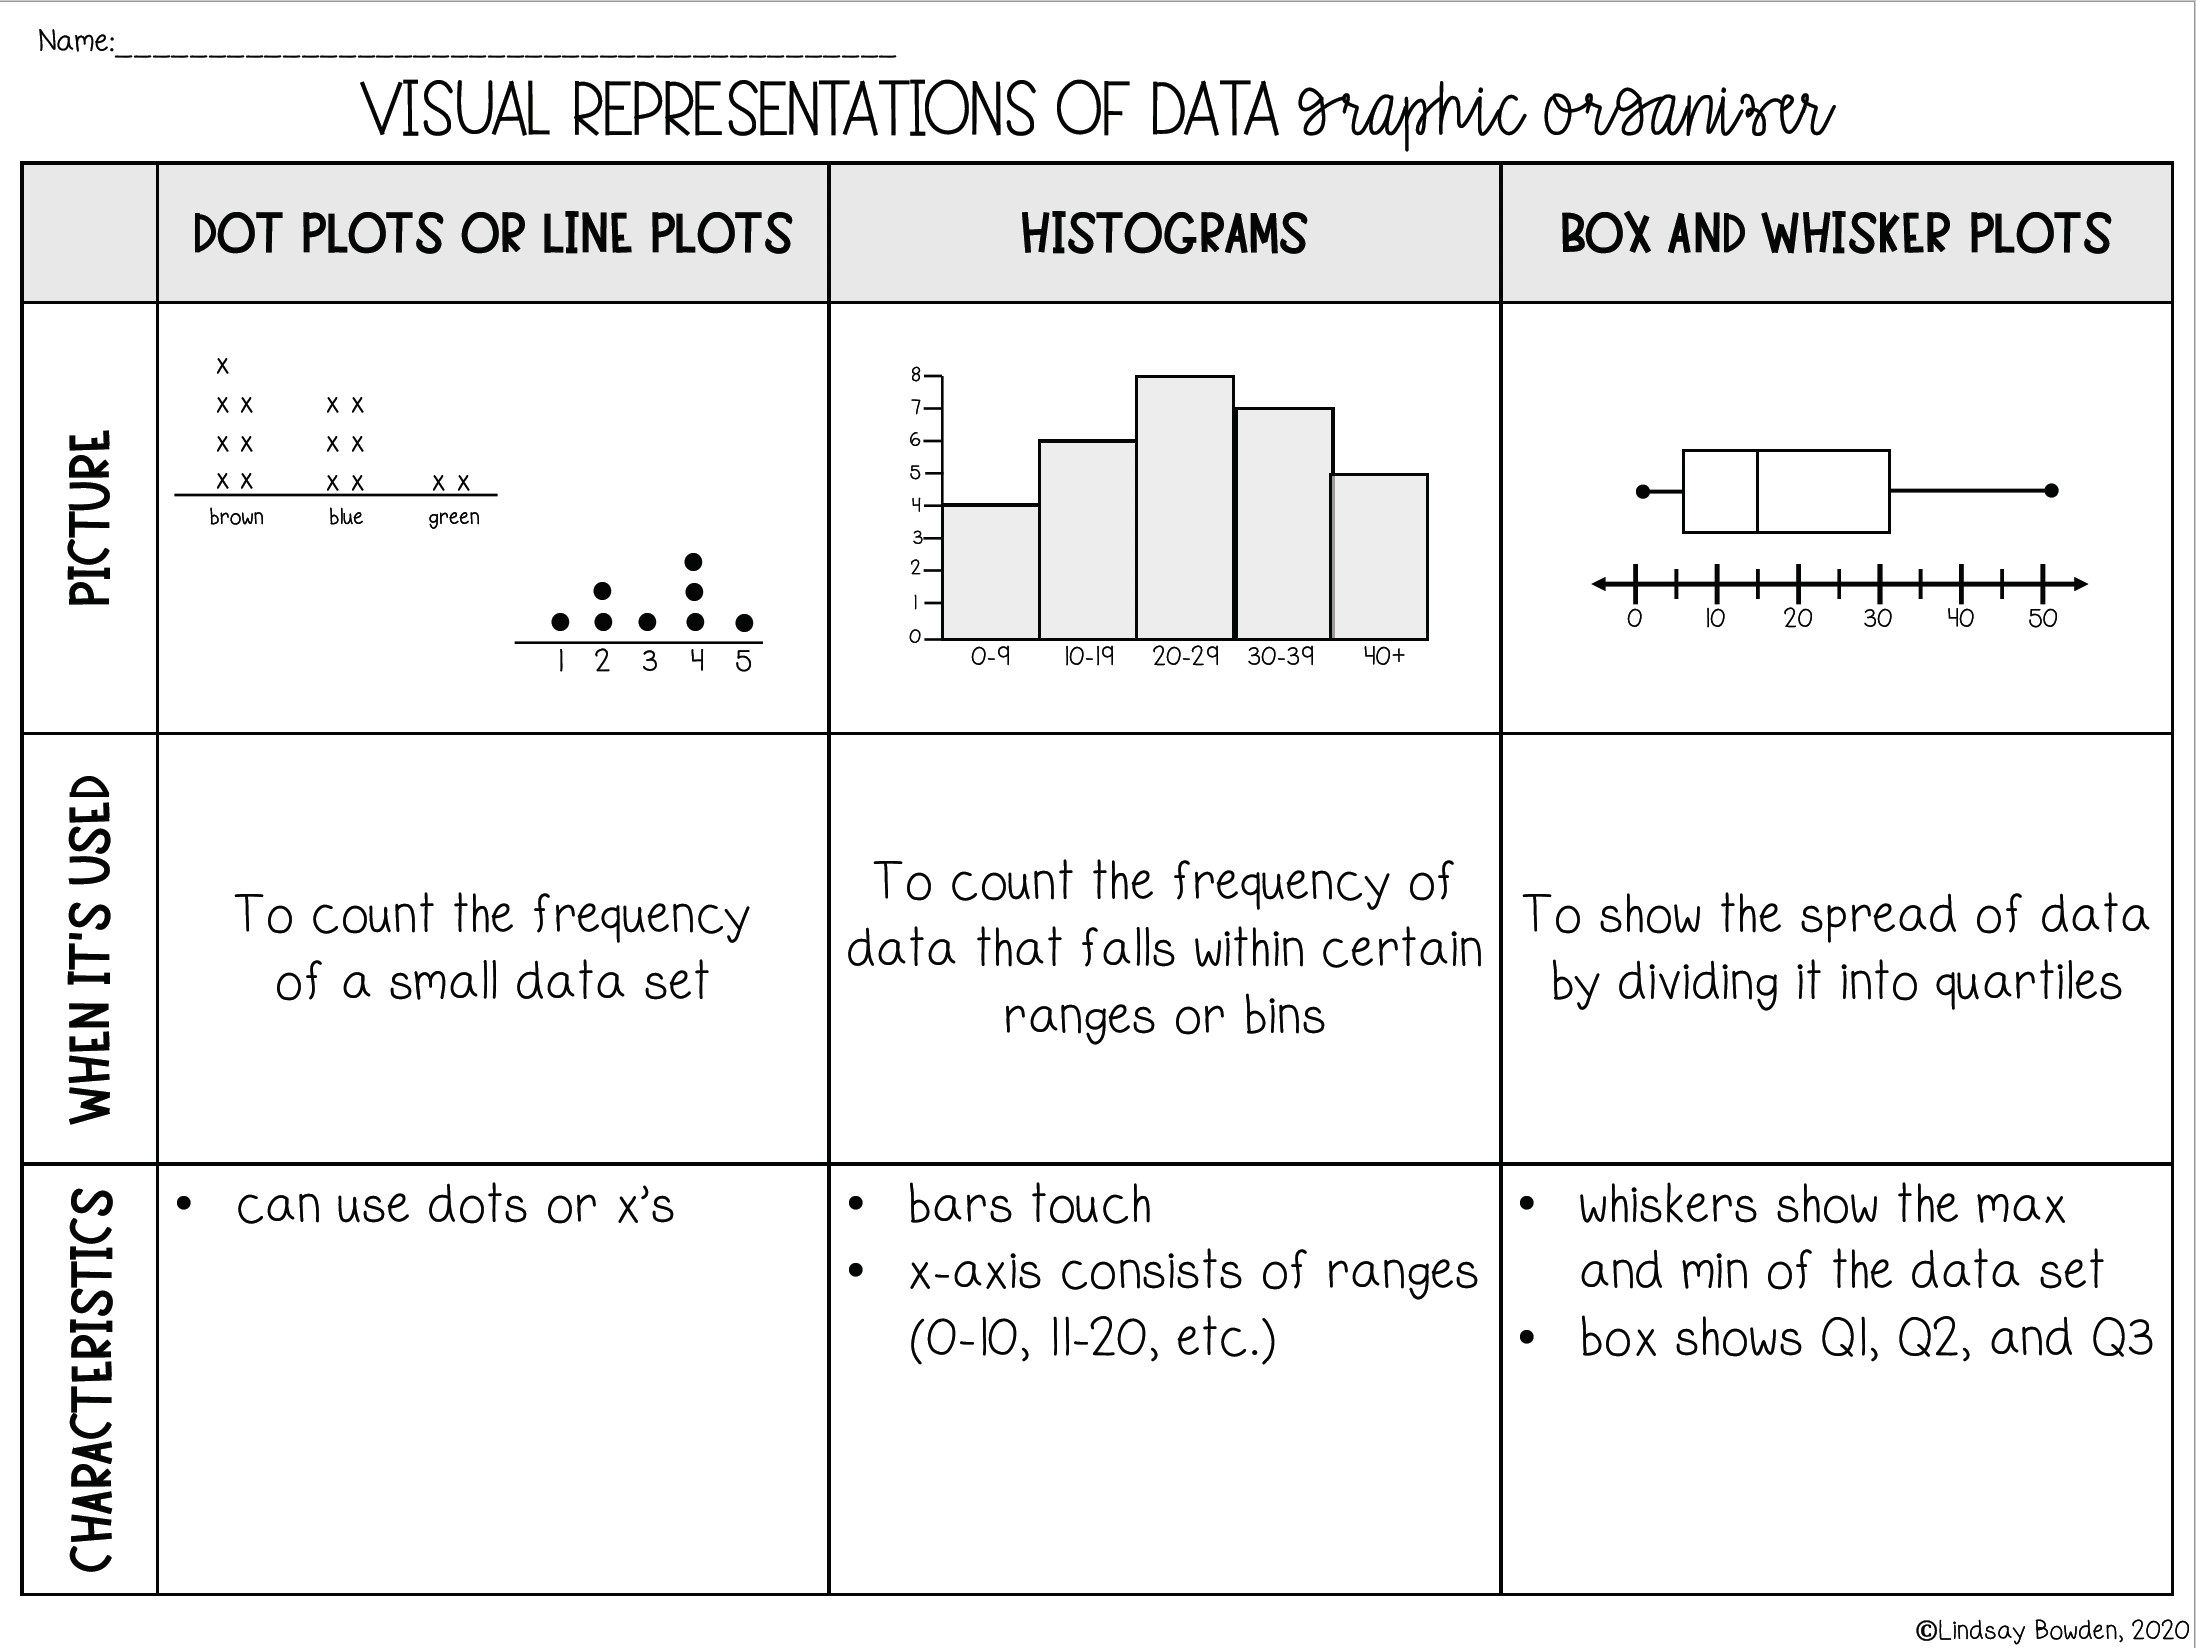
These Statistics Graphic Organizers help students compare histograms, dot plots, and box-and-whisker plots in High School Algebra 1!
✅ Includes:
-
Comparisons of histograms, dot plots, and box-and-whisker plots
-
3 versions with varying amounts filled in for differentiation
-
Answer key included!
📌 Perfect for: Interactive notebooks ✏️ Test prep 📝 Struggling students 📖
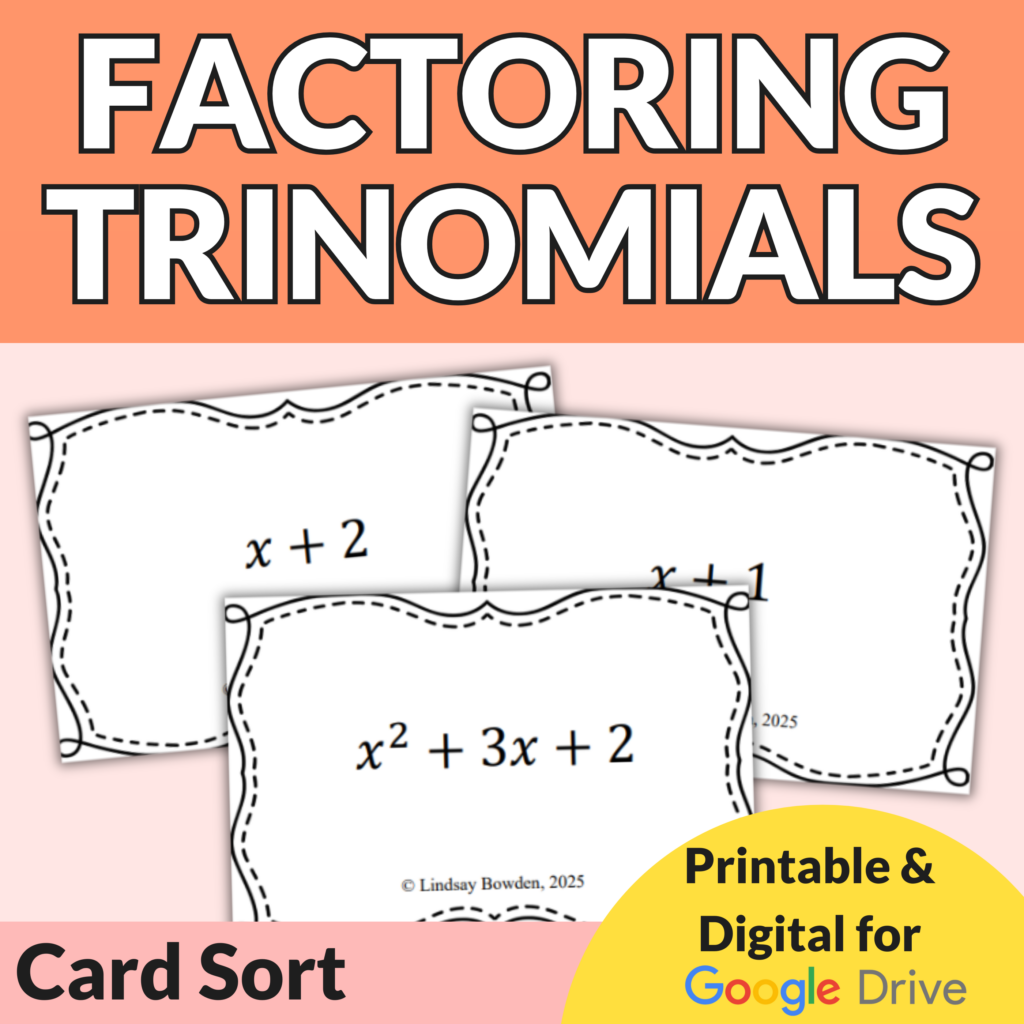
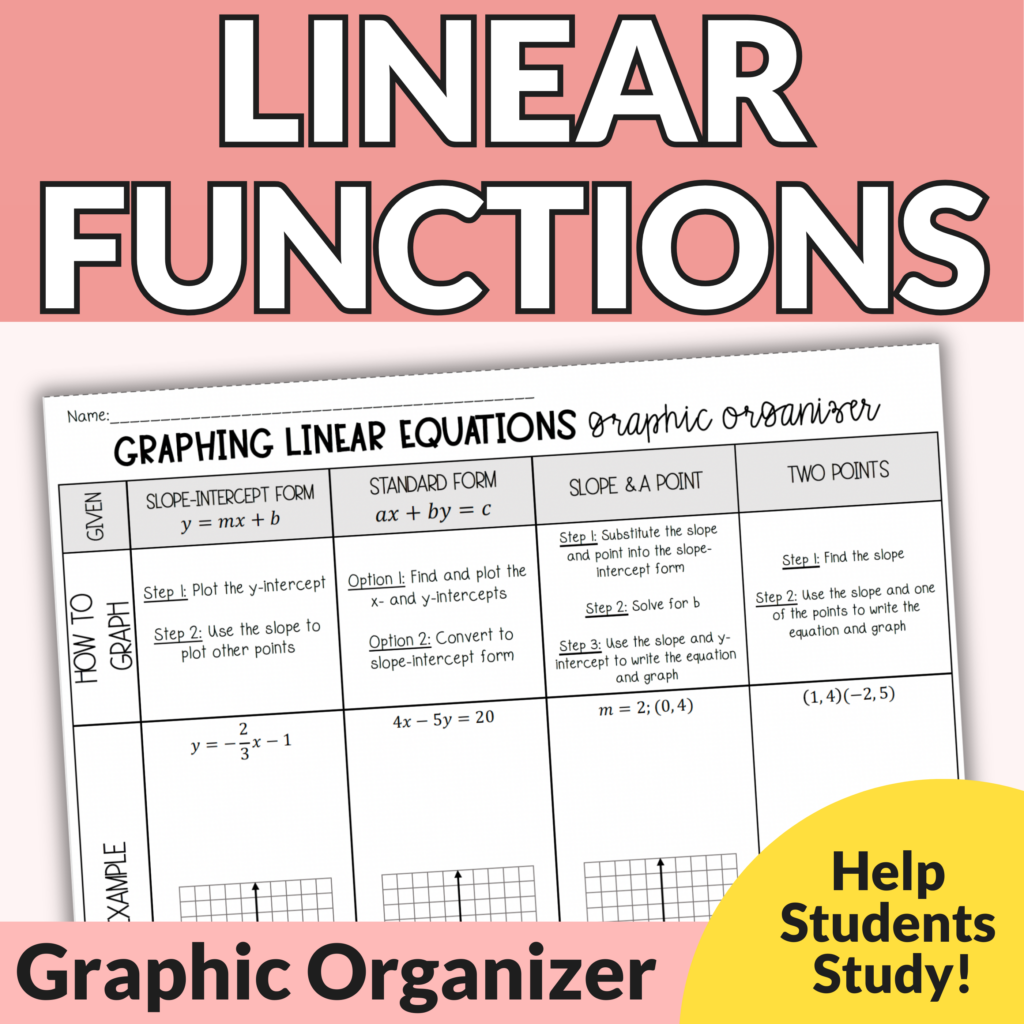
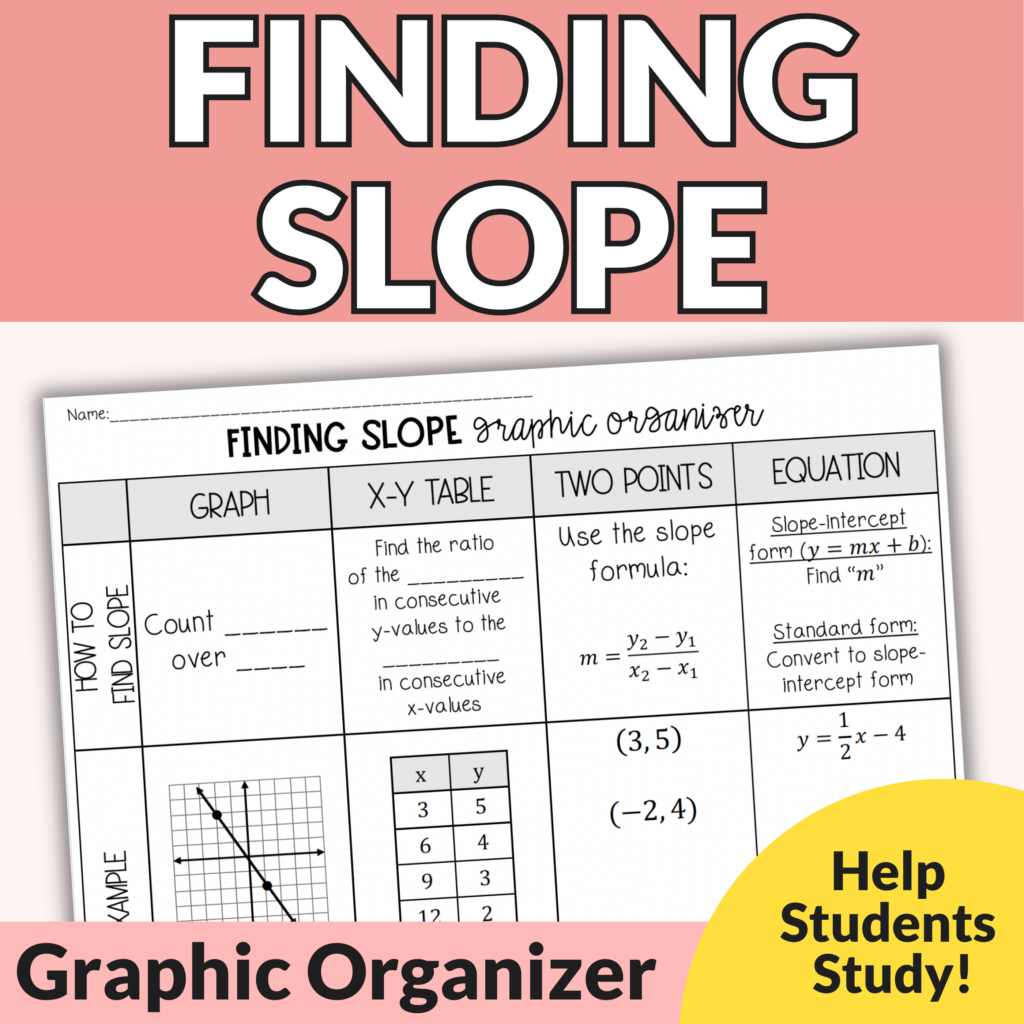
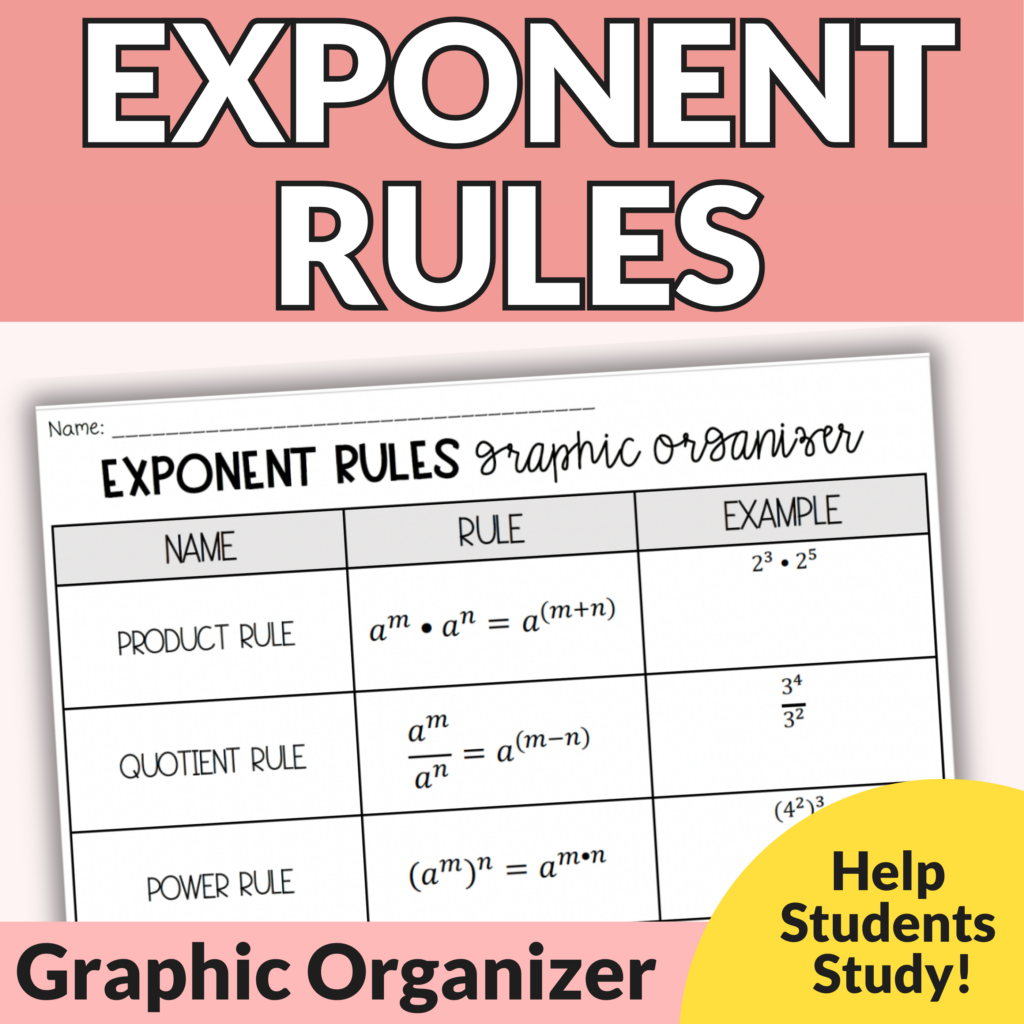
You may also like:
Terms of Use:
This product should only be used by the teacher who purchased it. This product is not to be shared with other teachers. Please buy the correct number of licenses if this is to be used by more than one teacher.
Did you know?
You can receive TPT store credits to use on future purchases by leaving feedback on products you buy! Just click on “My Purchases” under “Buy”!
Connect with me!
START YOUR ONLINE BUSINESS TODAY
BUILD & GROW YOUR DIGITAL STORE
START YOUR ONLINE BUSINESS TODAY
BUILD & GROW YOUR DIGITAL STORE
START YOUR ONLINE BUSINESS TODAY
BUILD & GROW YOUR DIGITAL STORE
You may also like...


Free Video Training:
Earn 4-Figures a Month by Selling Teacher Resources
Free training hosted by Lindsay, top 1% seller with $300K+ in earnins from Teachers Pay Teachers